The U.S. economy, inflation, jobs, rates and growth
On this page
The economy page gathers the main U.S. economic figures on one screen: prices, jobs, wages, interest rates and growth. Each is a tile with its latest value, its change and a chart of its history.
#The tiles
Open Economy in the Finance section bar.
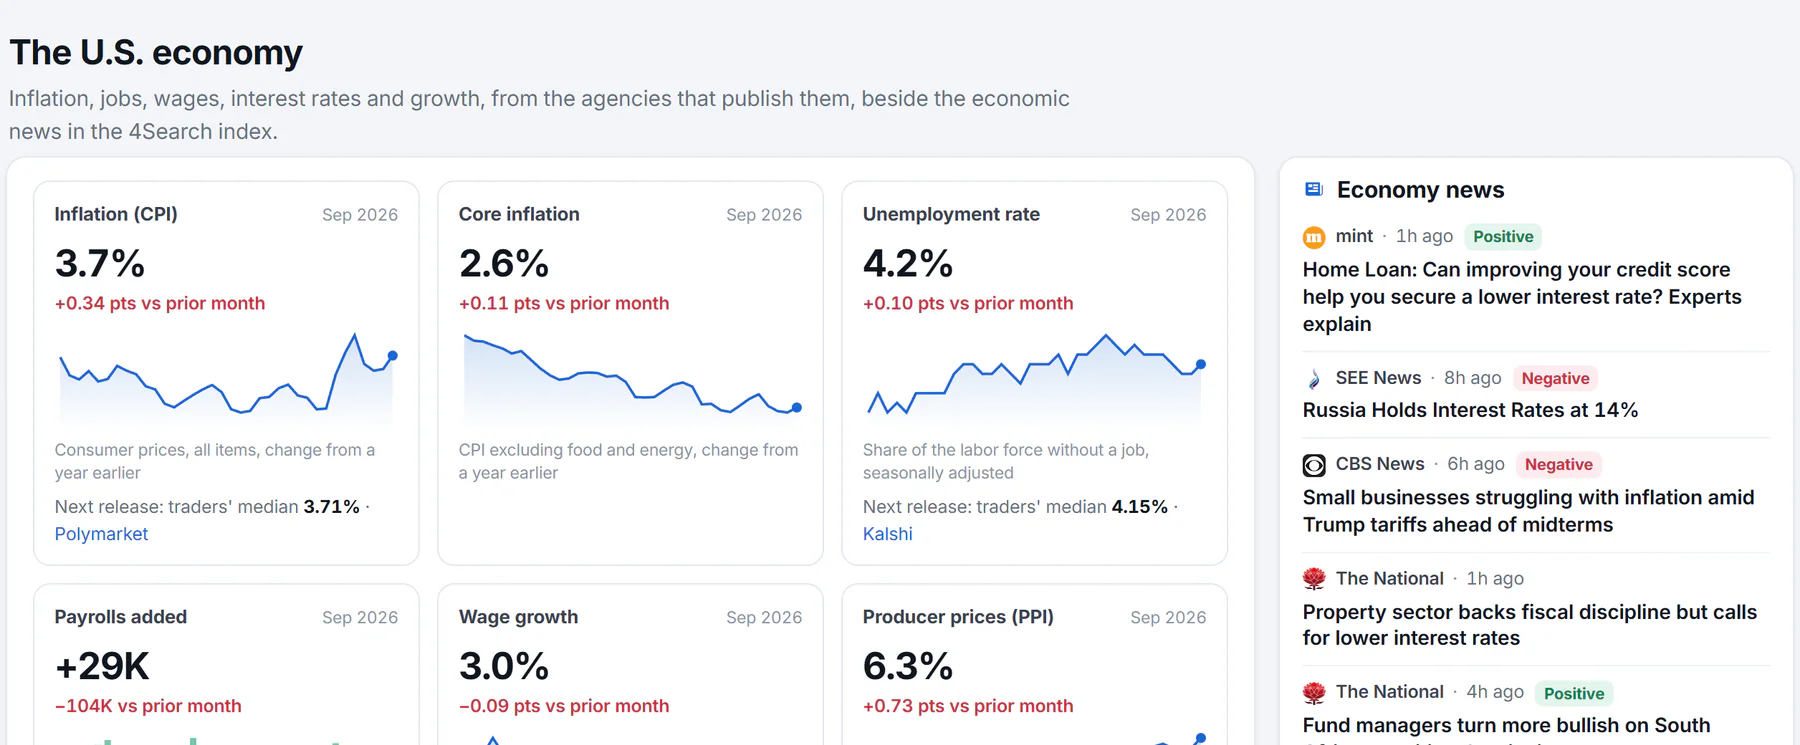
One tile per indicator: the latest value, its change, a chart of its history and what traders expect next.
- 1One tile for each indicator
- 2Change from the month before
- 3Its recent history
- 4The month the figure is for
Each tile shows, from top to bottom: the indicator's name and the month it is for, its latest value, how much it changed from the month before, a small chart you can hover over for any point, and a one-line description. A change is colored by whether it is good news: a rise in inflation or unemployment shows red, and a rise in jobs or wages shows green.
The tiles are:
| Tile | What it measures |
|---|---|
| Inflation (CPI) | Consumer prices, all items, as the change from a year earlier |
| Core inflation | The same without food and energy |
| Unemployment rate | The share of the labor force without a job, seasonally adjusted |
| Payrolls added | The monthly change in the number of jobs, in thousands |
| Wage growth | Average hourly earnings, as the change from a year earlier |
| Producer prices (PPI) | Prices that producers receive, as the change from a year earlier |
| Labor force participation | The share of the population working or looking for work |
| Fed funds rate | The rate banks charge each other overnight, and the Fed's target range |
| GDP growth | The economy's annualized growth in the latest quarter |
| 30-year mortgage | The average 30-year fixed mortgage rate |
| Consumer sentiment | A survey index of how consumers feel about the economy |
| Retail sales growth | Retail and food-service sales, as the change from a year earlier |
| 10Y-2Y spread | The 10-year Treasury yield minus the 2-year yield; negative means the curve is inverted |
A figure that is not available is left out. Some of these tiles, such as GDP, mortgage rates, sentiment and retail sales, depend on a second source and may be missing for a while.
On some tiles, such as inflation, unemployment, payrolls, the Fed funds rate and GDP, a line such as Next release: traders' median 3.71% gives what prediction-market traders expect the next report to say. These are traders' prices, not forecasts by 4Search, and each ends with the venue's name. See Prediction-market odds.
#What the markets expect from the Fed
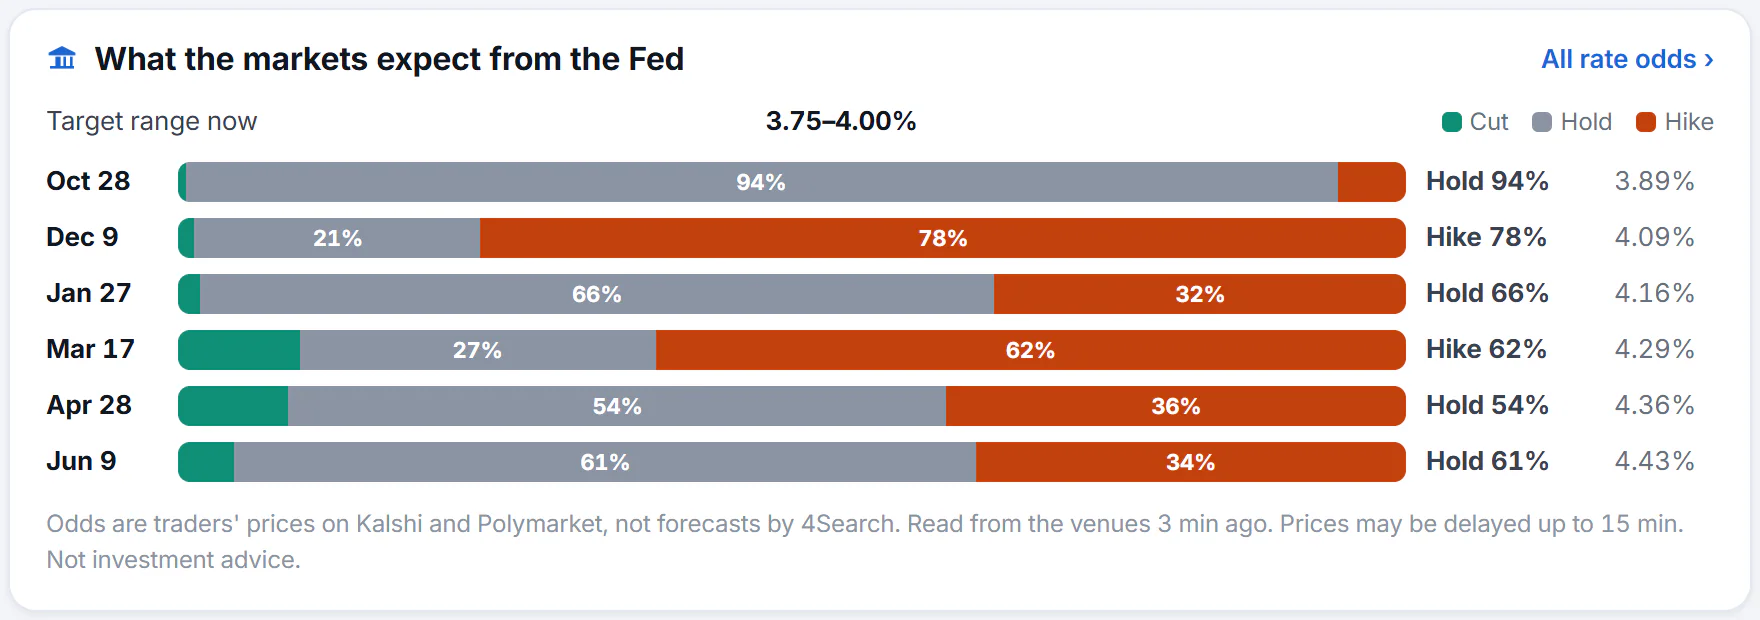
The Fed card: a bar for each coming meeting split into the chance of a cut, a hold or a hike.
- 1Where the Fed's target range is now
- 2One row for each coming meeting
- 3Cut, hold or hike
This card shows the Target range now and, for each coming meeting of the Federal Reserve, a bar split into the chance of a Cut, a Hold and a Hike, the most likely outcome in words, and the midpoint of the target range that those odds imply. Select a date to open that market. All rate odds opens the full page.
#Yields, gauges and news
The Treasury yield curve card is a shorter version of the chart on Rates and bonds. Market gauges lists the 10-year yield, the 3-month bill, the dollar index, crude oil and gold. Economy news shows the latest economic headlines.
The figures come from the official U.S. agencies that publish them, and the note under the tiles names them. They are updated when the agencies release new figures, usually once a month, so a tile can be a few weeks old.
#Common questions
Why does the date on a tile say a month, not today?
Most of these figures are published monthly, a few weeks after the month ends. The tile shows the month it is for.
What does "CPI" stand for?
Consumer Price Index, the standard measure of inflation. The tile shows how much prices have risen over the last twelve months.
Is this a forecast?
No. The tiles show what has been published. The odds are what traders expect, which is a different thing from what will happen.